Love my SSL2. But either it or the MOTU are solid choices, they are basically the best two of the sub-$500 tier of audio interfaces.
4 Likes
Yep, understood, @howard. And I appreciate you turning me on to both DAIs. 
In my research, I found a lot of glowing reviews for the SSL2 2+ and the MOTU M2. But there were some disturbing complaints about them, too.
If both units cost the same, I’d likely go with the SSL2 2+ for its top-mounted control panel. But I’ve read some disturbing reviews of units dying in about a year. This wan’t a uniformly reported thing, but many users aren’t happy with the product for that reason. One bass online reviewer said he didn’t think the SSL2 2+ sounded natural: too digital sounding. I dunno.
I dig the look of the MOTU M2, and it does offer a good price for a lot of performance. On the other hand, I read that some users have come to strongly dislike the front-mounted control layout. Again, just what I’ve read in reviews.
Hell, I just might flip a coin and call it a day. 
3 Likes
Not that I continue to obsess about things lodged in my brain, but I like Genzler’s choices on center frequencies for the Re/Q.

All Badwater had to do was make the hi-mid dial go lower to be in the range where this pedal has 3 bands and it would be fine.
However, poking around I found something that I didn’t realize. The Source Audio EQ pedal only looks like a fixed frequency graphic EQ. It’s actually fully parametric on every band snd allows high/low pass options on filter type. It’s also a two channel device with different EQ on each channel. One entire EQ channel could be reserved for venue problems. Or one EQ could be used just to feed a distortion with the other EQ being last in the chain.

4 Likes
@MikeC I’ve seen the same “dead within a year” reviews about the Motu M2. I’ve just chalked it up to every company having lemons.
If this was true across the board, they wouldn’t be able to compete at even a third of the price. Could this review have come from a defective unit?
I wouldn’t say “strongly dislike”. At the end of the day, I think the Motu M2 is pretty awesome. Maybe it’s a “mild first world inconvenience”. ![]()
I would like for the controls to be on top. It seems more intuitive for a desktop unit rather than a rack mount unit to put the controls on top. But, I’m still very happy with it.
I think you need to get both, do a comparison, send back the one you don’t want, and then come tell us about it. But, my advice is sometimes not fiscally… good. ![]()
![]()
![]()
3 Likes
It sounds completely bonkers to me FWIW since SSL’s selling point is that it can sound like (and emulate) the SSL4k (analog) preamp warmth…
3 Likes
There’s a good chance running an FFT on it may reveal at least part of that answer. I’d be curious how it tests compared to something else.
3 Likes
Should be able to get that from any graphical EQ view, unless I am missing something ![]()
Those are all conversion to the frequency domain and presumably using FFT to do so…
1 Like
FFT also shows transition over time if it’s at all melty.
2 Likes
I guess what I am asking is, do you know any way to convert into the frequency domain without doing a FFT? I don’t…
AFAIK the EQ views are FFT’s.
1 Like
What’s an FFT?
1 Like
An FFT is short for Fast Fourier Transform. You put a known all-frequency signal into a system and then look at what comes out. You can measure how a signal is changed by a system.
An EQ curve is a slice of a transform in time. If you rang a bell, the frequency that it rings for 30 seconds couldn’t be singled out in an EQ curve of the first strike, but it would in an FFT.
The result of making an FFT measurement is an IR file. It revels what’s between the in and the out of a black box, with some limitations.
This is how PA systems get their EQ settings made. The EQ is set upside down to the IR of the system to flatten out its frequency response.
4 Likes
@eric.kiser The die-within-a-year review comments referred to the SSL2 2+, not the MOTU.
And, again, I didn’t make the review comments, I just reported that I ran across some out there, which served to confuse me.
First-world problems, absolutely, man.
Bottom line, I think both the MOTU M2 and the SSL2 2+ are damn good products. If I could meld the features and price of the two, there would be no question.
3 Likes
There’s no way to recover time data without the IR. If you have the spectrogram function in izotope you could hard cut pink noise and see if the waterfall stops abruptly with the cut or if anything rings out.
I’ll have to poke around and see if there an FFT VST for a reasonable price. The Smaart PA tuning software is pricey for only playtime.
3 Likes
Basically all conversion of input signals, which are sampled in the time domain (i.e. varying amplitudes over time) into a display that shows things in the frequency domain, like a spectrogram or equalizer curve, are done by running a FFT on the signal. So this display:
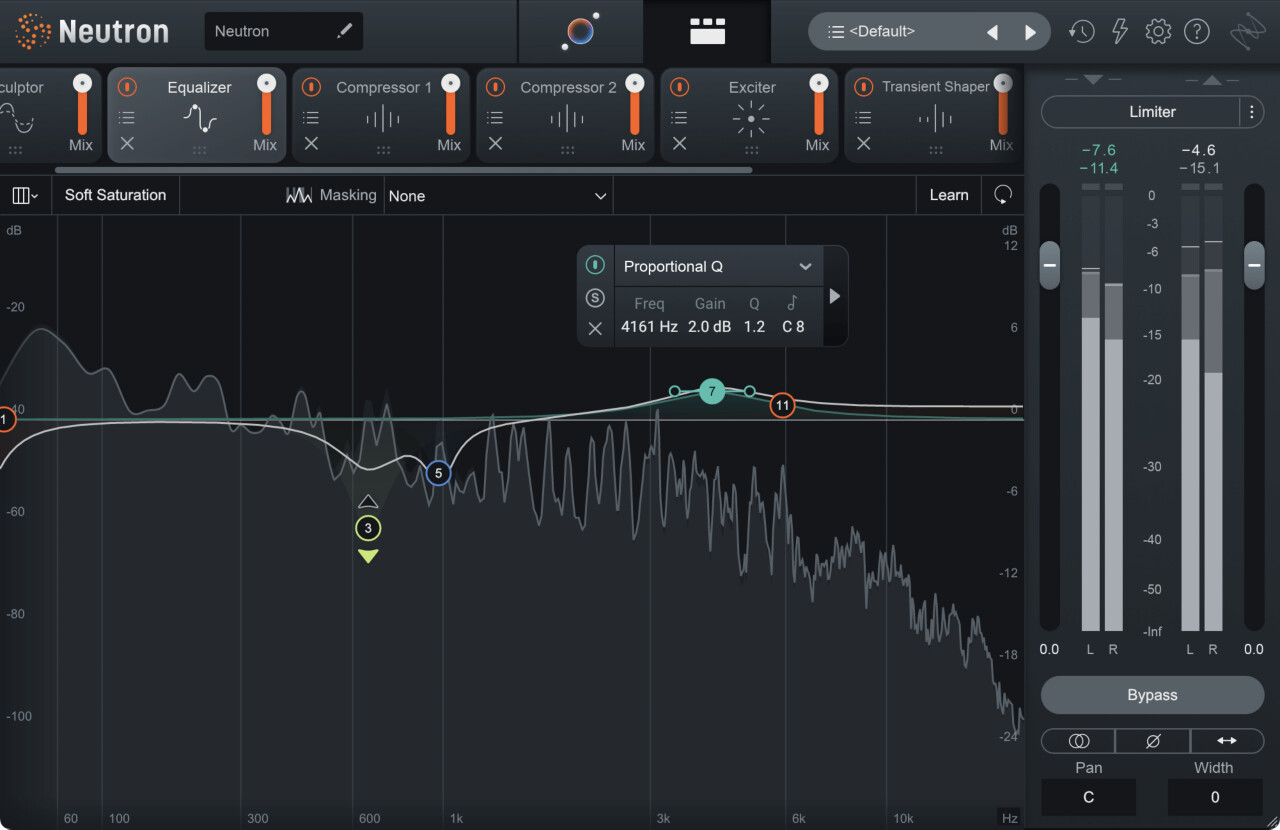
is a FFT (shown on a log scale). At least as far as I know.
This was part of my major in college but it’s been a long time since then so there may be other methods now 
2 Likes
Ah yes, correct, with the limitation of the time window of the FFT that was run. You can get an EQ plot for the first moment in time, but not necessarily have access to how that changed over time unless the FFT was long enough.
3 Likes
All sounds can be reduced to the shift-phased sum of sine amplitudes through Fourier transformation. The amplitude of a sound wave is this sum of sine-wave constituents of the current sound, which is called a sample (as in sample rate) calculated according to the given sample rate → 44,1 kHz is 44 100 samples (calculated Fourier transformations) every second that moves the speaker driver. Bit rate is the expression accuracy of a given sample.
You can convert back soundwave amplitude into the sound spectrum by reverting the process above, you just need some time running, because … frequency is a function of time.
That’s also why peaks and going over buffer and so on sound like crackling … because you have a change in time, but no change in the amplitude. (delta between the peak of 100 and peak 100 is 0 → no sound)
5 Likes
Yep! That’s coming at it from the other direction, and is the foundation of additive synthesis.
My use of all of this in college was in signal processing and capture, sampling in to buffers after running analog signals through ADC’s. Which, it turns out, is exactly like signal processing an audio stream through a DAI into a DAW’s buffers (and eventually, tracks).
FFT was a typical early step in analysis, to convert to the frequency domain.
4 Likes
I wrote, with my classmates, an algorithm that converts visual data to sound. We were able to handle only translucent materials, but … from that time I am absolutely sure that security agencies do have gear that can hear a mouse fart through a concrete wall.
4 Likes
When you are talking about modern gear with like -130dB noise floors… crazy times
3 Likes
I like to think I’m pretty smart, but you guys have lost me. Like, completely 
3 Likes